~/writing/2016/08/22
Setting up collectd plugins with Graphite and Grafana
Originally published on heXoughts, my Octopress blog, in 2016. The Disqus thread came along with it.
Intro
Installing collectd could be trivial, although setting up monitoring for continuous time-series metric collection should be simpler. This post is aimed at helping sysadmins setup collectd and connect it to a graphite instance, so that all those metrics could later be viewed from Grafana instance.
Note:
This post is a spin off from the main satperf project. To take a look at how satperf works, refer to this post
The process
Step 1
Install collectd for your system, Install Graphite server elsewhere (recommended: separate machine).
Step 2
When that’s installed, take a look at your /etc/collectd.conf and add plugins from the list below, as suitable
# Allow collectd to log
LoadPlugin syslog

# Loaded Plugins:
LoadPlugin write_graphite
LoadPlugin cpu
LoadPlugin df
LoadPlugin disk
LoadPlugin interface
LoadPlugin irq
LoadPlugin load
LoadPlugin memory
LoadPlugin numa
LoadPlugin processes
LoadPlugin postgresql
LoadPlugin swap
LoadPlugin turbostat
LoadPlugin unixsock
LoadPlugin uptime
Note:
-
If you’re installing this on Red Hat Satellite, you might wanna make additional changes as per this template in satperf
-
For others, you might wanna take a look at the above mentioned link anyway, for it serves as a generic reference for
/etc/collectd.conf -
Replace variable names in above referenced satperf’s
collectd.confas per following defaults / or change them as suitable:
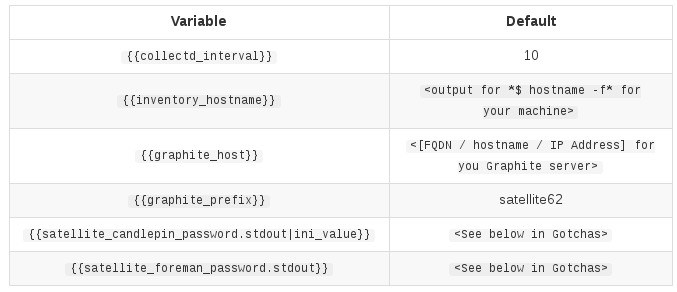
Gotchas (for both Satellite setup as well as normal setup):
-
10 refers to 10 seconds
-
end results on graphite-web UI show under Metrics:
{{graphite_prefix}}.{{inventory_hostname}}.<metrics as per output from plugins>- For candlepin password:
$ grep "jpa.config.hibernate.connection.password" /etc/candlepin/candlepin.conf | awk -F'=' '{print $2}'`- For Satellite Foreman password:
$ grep "password" /etc/foreman/database.yml | awk '{print $2}' | tr -d '"'Step 3
Once this is done, reload collectd server and check logs on graphite server to make sure you’re able to receive data
Other Gotchas:
- Use
iptables -Fif unable to send collectd metrics - To graph the other parameters in Grafana, this satellite generic dashboard file
- To simply look at which metrics are touched in above dashboard template, refer to this satperf vars file
- FYI, I’ve got an open PR to add collectd info to sos report, as a plugin
- I’ll add some screenshots to this post ASAP.